Reading Histogram for Better Pictures : Histogram Explained in Lightroom
If you are wondering what Histogram is, please read Understanding Histogram : How to Use Histogram to get correct Exposure article.
Reading Histogram for Better Pictures
Reading Histogram for Better Pictures. Reading and knowing histogram will help you understand the exposure of your shots in Lightroom. Histogram can help you in two ways: while you’re taking a live shot as well as later while editing the pictures. The histogram is an invaluable tool for any photographer during post-processing in Lightroom.
Histogram Explained in Lightroom
Histogram Explained in Lightroom. You can start by opening Lightroom, selecting an image and open the Develop Module. You’ll see a small, black rectangular box on the upper right side of your screen. It looks complicated but believe me its not. Once you open the histogram, you might be tempted to return to a previous screen and directly edit a photo by hitting auto “enhance”. Stop! The Histogram adds tremendous value to an image, and it’s far easier to use than it looks. It is an very amazing and simple tool for adjusting the contrast, highlights, shadows, and overall brightness of an image and see how histogram is reflecting or updating after the edits. Now let’s understand what we need to check exactly in Lightroom application.
Underexposure:
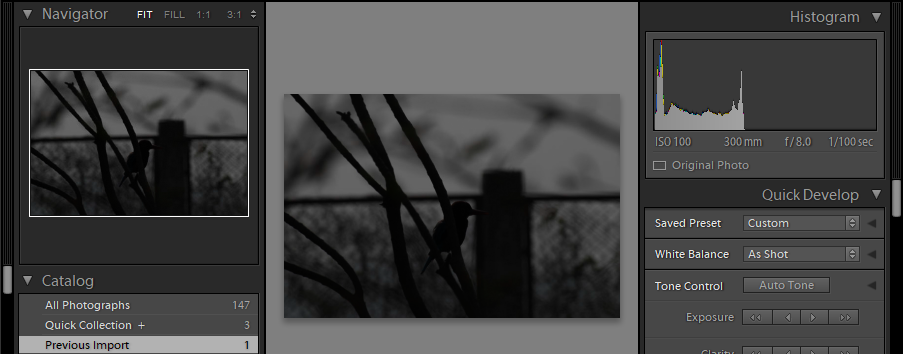
This is a underexposed image (very dark) where you can hardly see any details. If you check here (top right side) in histogram, it clearly shows a strong shift to left side which means most of image is in shadows and completely black which lacks any details :

Overexposed:
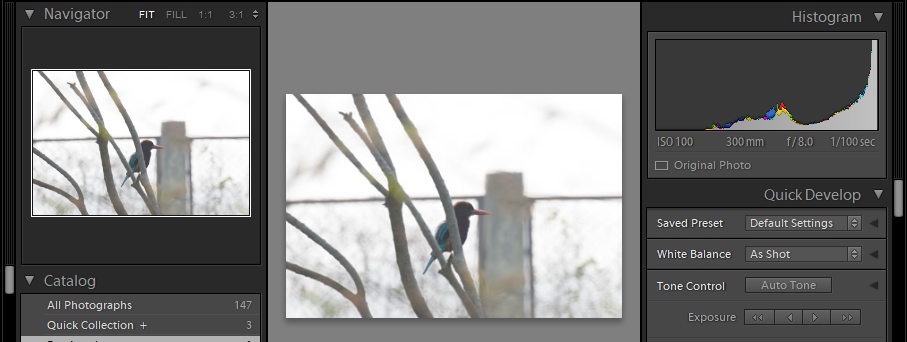
This is a overexposed image (too much light) where many tones are very bright with almost no dark tones in pictures. Due to too much light almost entire image is blown-out and lacks details. Check histogram here, it clearly shows a strong shift to right side, which means most of image is too bright and blown-out (completely white and bright).

Correct Exposure:
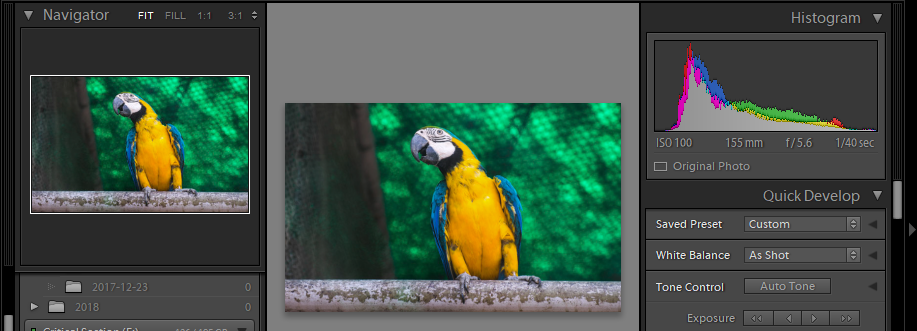
Lets analyze histogram here, there is no vertical bars on either side of histogram, which means there is no detail lost in shadows or there is no part of image which has been blown out because of too much brightness. If you see closely, histogram spikes up on the portion of image where parrot is placed. This part of histogram showing the tones of parrot, it is properly exposed and has enough details too.

Breaking the Rule :
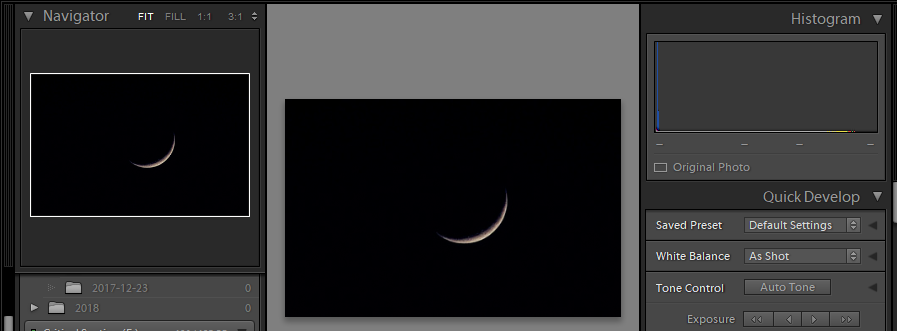
What about below image? Is it underexposed ? very dark with no details.. Right ? Here Histogram also tells us that super strong shift to the left side which means image is in shadow and lack details.

Would you try to correct it ? Off course NO. The truth is histogram can not be evaluated on the basis of exposure. The correct histogram depends on many factors. Histogram merely shows you the amount of tones of various brightness levels in your image, and nothing more. It can be used to discover whether you have chopped any highlight or shadow detail at specific exposure settings.
Conclusion :
So in this article “Reading Histogram for Better Pictures : Histogram Explained in Lightroom” we have seen how to interpret and use the histogram. With the help of it, you can quickly understand and assess the exposure and contrast of every shot you import into Lightroom. This will help you to make adjustments in a more decisive way than you may otherwise.
Love this article ? Please share.